
The outstanding fourth-quarter earnings season we had in 2020 is a tough act to follow, but 2021’s first quarter has the makings of another potentially great earnings season. The reopening of the economy continues to move forward, and corporate America has done an excellent job managing through the pandemic. In fact, it won’t take much of an upside surprise for year-over-year S&P 500 Index earnings growth to reach 30% this quarter. The 2021 earnings boom is here.
Poised For Another Strong Earnings Season
Coming into fourth-quarter earnings season, investors had plenty of reasons to expect companies would deliver better-than-expected results—and they did. Virtually no one—ourselves included—expected S&P 500 companies to grow earnings in aggregate during fourth quarter 2020, especially considering fourth quarter 2019 was over before the pandemic began in the U.S. Well, corporate America delivered 4% year-over-year earnings growth in the fourth quarter of 2020 despite the difficult year-over-year comparison, as shown in [Figure 1], which was about 13 percentage points better than the consensus estimate when the fourth quarter began on October 1, 2020.
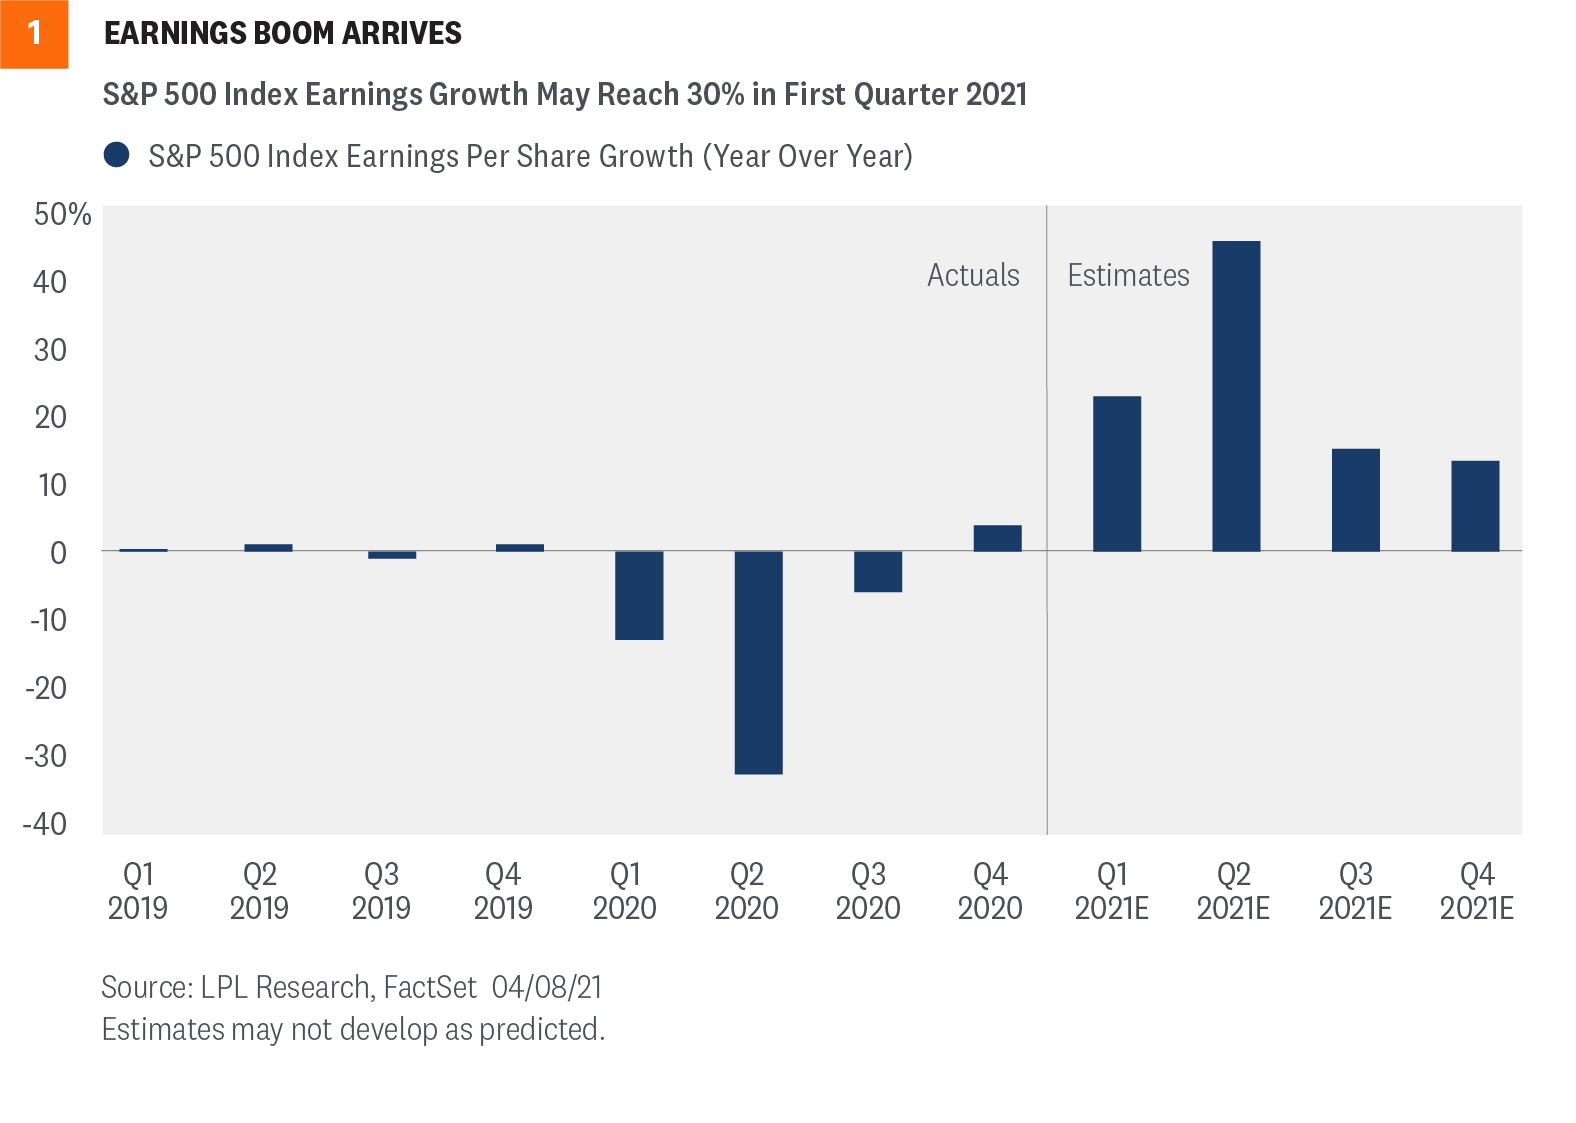
The first piece of good news is that we now have much easier comparisons over the next couple of quarters, setting up a possible 30% year-over-year increase in S&P 500 earnings for the first quarter of 2021. FactSet consensus is currently calling for a 24% increase, and six percentage points of upside appears very realistic given double-digit upside surprises the past three quarters.
The second piece of good news is that most of the factors that contributed to such a big upside surprise last quarter remain in place today, including the following:
Click here to read the rest of the report.
IMPORTANT DISCLOSURES
This material is for general information only and is not intended to provide specific advice or recommendations for any individual. There is no assurance that the views or strategies discussed are suitable for all investors or will yield positive outcomes. Investing involves risks including possible loss of principal. Any economic forecasts set forth may not develop as predicted and are subject to change.
References to markets, asset classes, and sectors are generally regarding the corresponding market index. Indexes are unmanaged statistical composites and cannot be invested into directly. Index performance is not indicative of the performance of any investment and do not reflect fees, expenses, or sales charges. All performance referenced is historical and is no guarantee of future results.
Any company names noted herein are for educational purposes only and not an indication of trading intent or a solicitation of their products or services. LPL Financial doesn’t provide research on individual equities.
All information is believed to be from reliable sources; however, LPL Financial makes no representation as to its completeness or accuracy.
US Treasuries may be considered “safe haven” investments but do carry some degree of risk including interest rate, credit, and market risk. Bonds are subject to market and interest rate risk if sold prior to maturity. Bond values will decline as interest rates rise and bonds are subject to availability and change in price.
The Standard & Poor’s 500 Index (S&P500) is a capitalization-weighted index of 500 stocks designed to measure performance of the broad domestic economy through changes in the aggregate market value of 500 stocks representing all major industries.
The PE ratio (price-to-earnings ratio) is a measure of the price paid for a share relative to the annual net income or profit earned by the firm per share. It is a financial ratio used for valuation: a higher PE ratio means that investors are paying more for each unit of net income, so the stock is more expensive compared to one with lower PE ratio.
Earnings per share (EPS) is the portion of a company’s profit allocated to each outstanding share of common stock. EPS serves as an indicator of a company’s profitability. Earnings per share is generally considered to be the single most important variable in determining a share’s price. It is also a major component used to calculate the price-to-earnings valuation ratio.
All index data from FactSet.
Please read the full Outlook 2021: Powering Forward publication for additional description and disclosure.
This research material has been prepared by LPL Financial LLC.
Securities and advisory services offered through LPL Financial (LPL), a registered investment advisor and broker-dealer (member FINRA/SIPC). Insurance products are offered through LPL or its licensed affiliates. To the extent you are receiving investment advice from a separately registered independent investment advisor that is not an LPL affiliate, please note LPL makes no representation with respect to such entity.
| Not Insured by FDIC/NCUA or Any Other Government Agency | Not Bank/Credit Union Guaranteed | Not Bank/Credit Union Deposits or Obligations | May Lose Value |