Market breadth has been a hot topic this year as the rally off last year’s correction lows expanded beyond the closely followed mega cap stocks. Before diving deeper into market breadth, a definition is warranted. In general, market breadth can simply be defined as how many stocks are advancing versus declining within an index, sector, group, or market. Many investors associate breadth with the health of the overall market as it highlights what is going on underneath the surface of the index level. Higher breadth readings paired with a rising index equates to broad participation powering the rally, implying the advance is likely strong and sustainable. And while an index can rally with narrow breadth — as the S&P 500 did last summer and at the start of this year — prolonged divergences point to concentration risk and vulnerabilities for a pullback or trend reversal.
There are many ways to measure market breadth, and one of our favorites is to analyze how many stocks within an index are trading above their longer-term 200-day moving average (dma). This provides a snapshot of how many stocks are in an uptrend. A higher percentage implies broader breadth. (As a simple rule, when a security is trading above its 200-dma, it is generally considered to be in an uptrend, and vice versa if the price is below the 200-dma.)
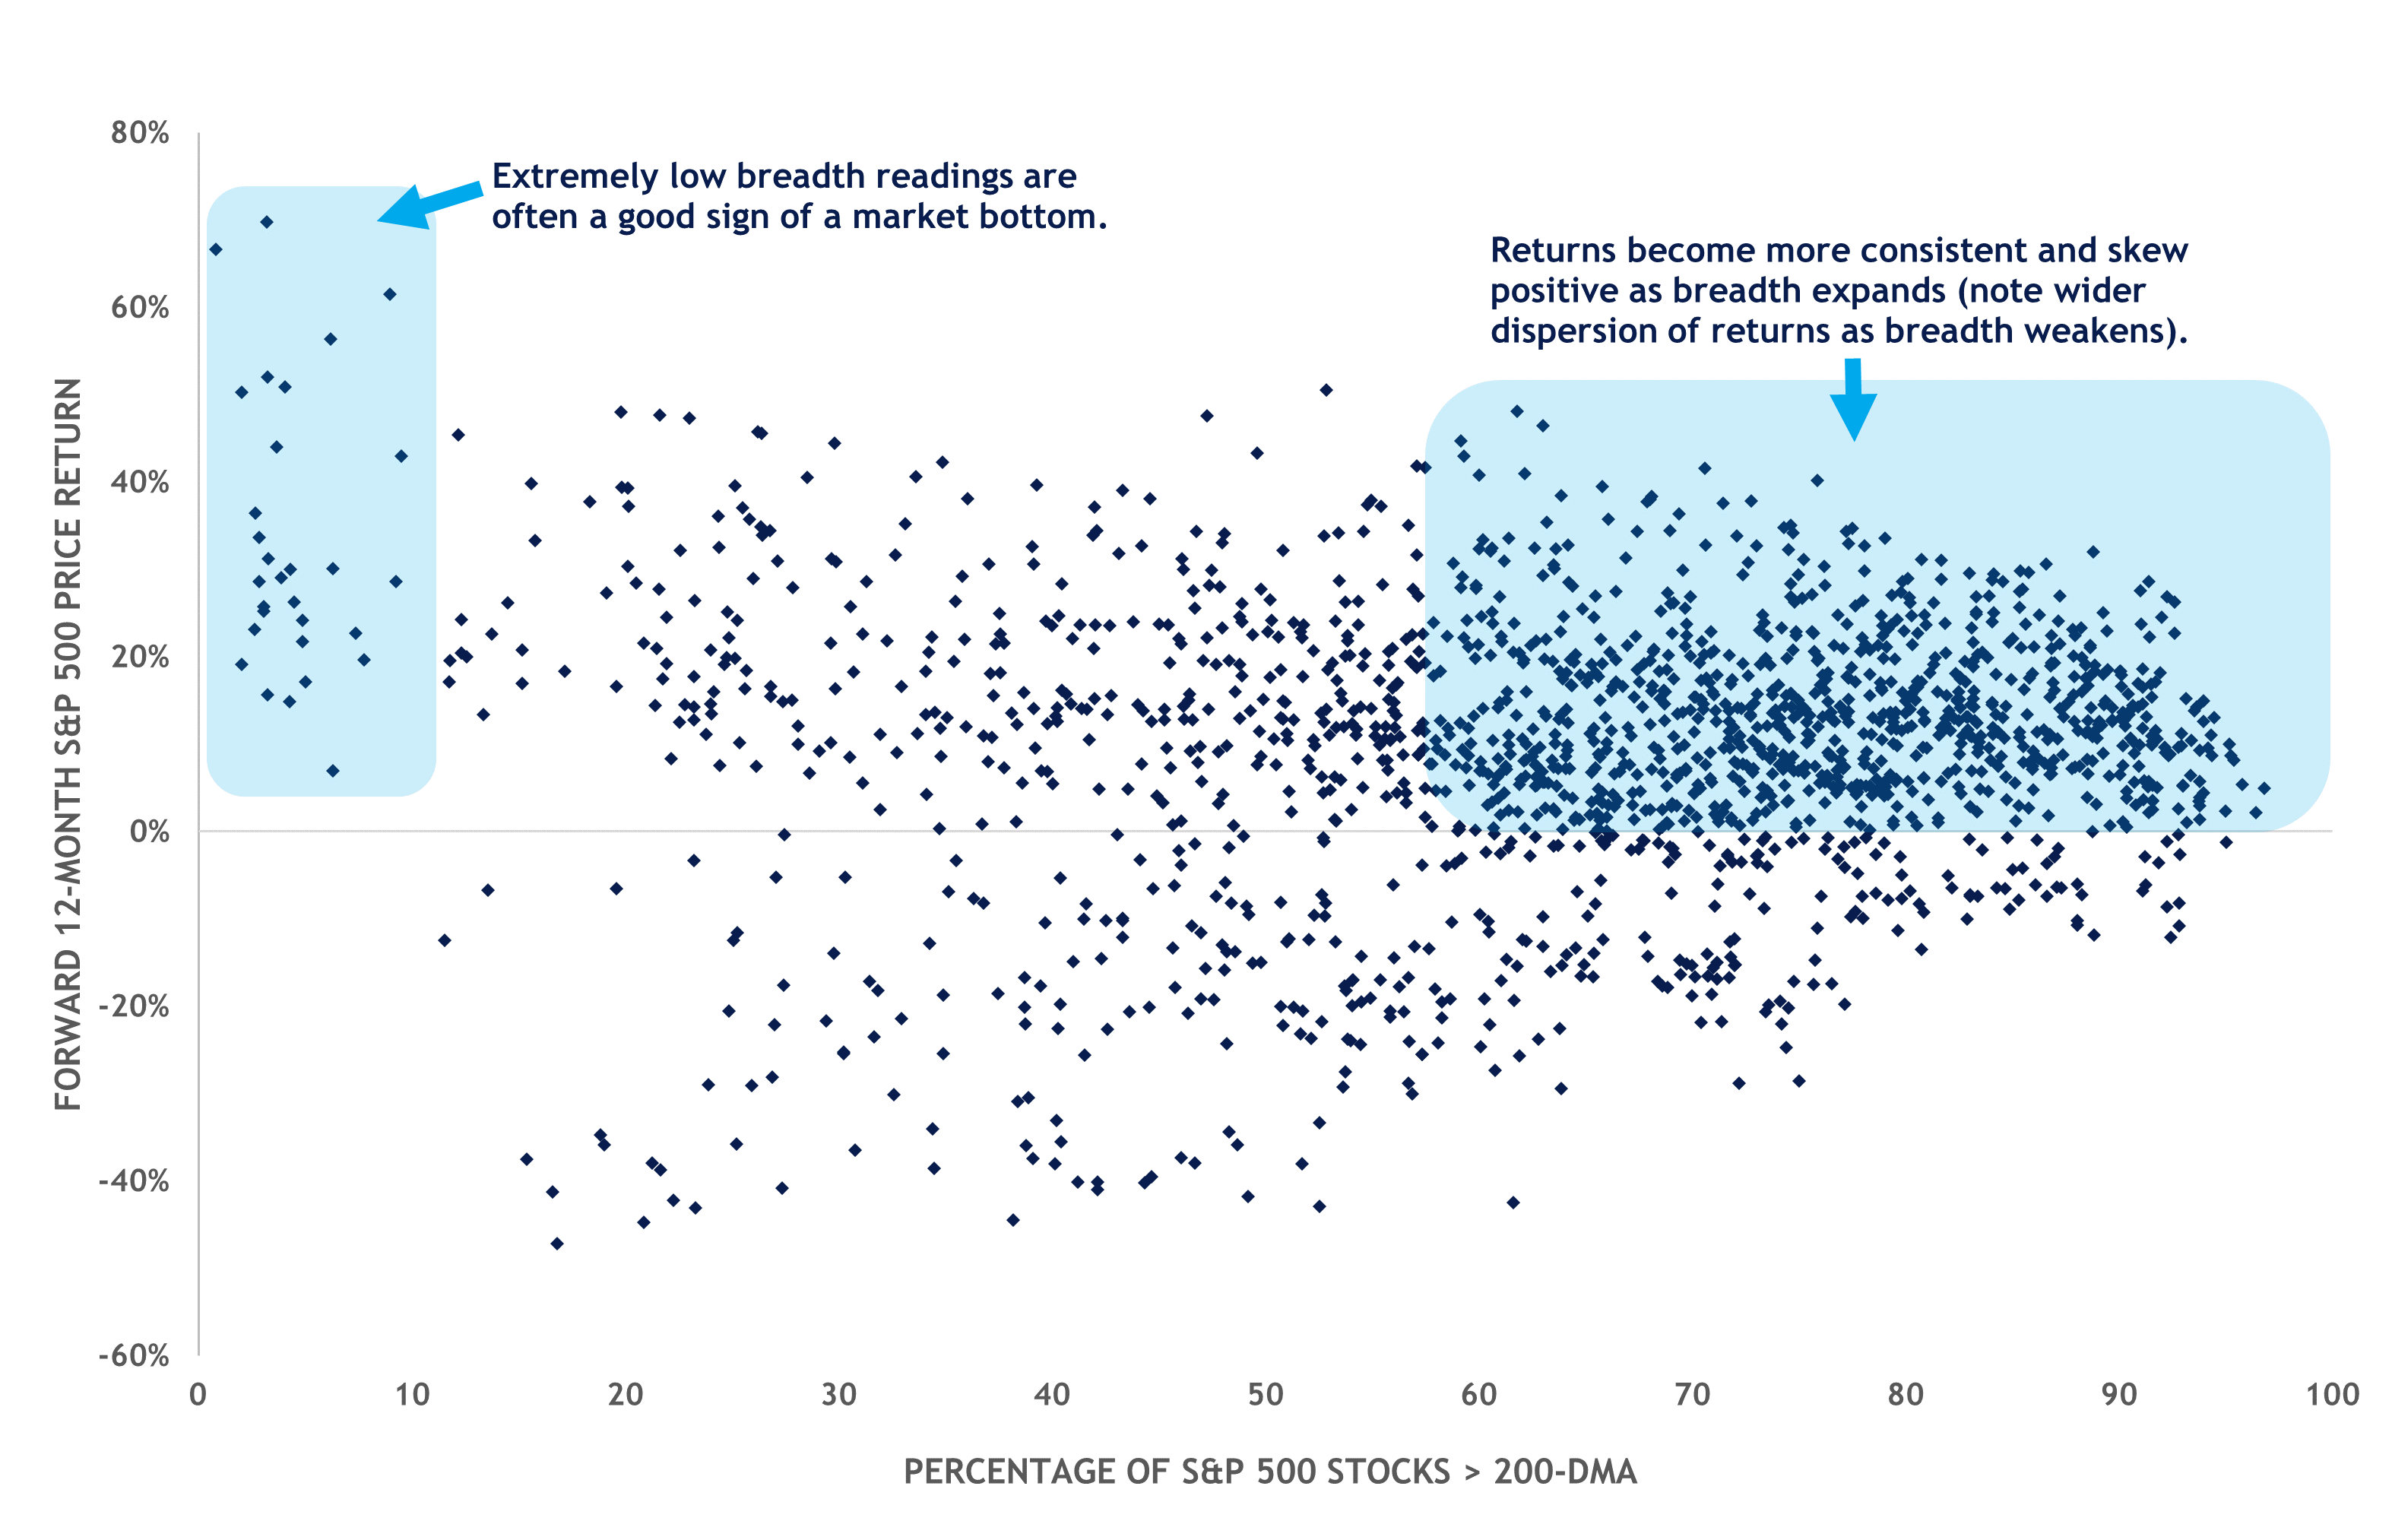
Now that we have established market breadth as an important indicator for assessing the health and direction of the overall market, we can also quantify its significance to market returns. In the scatterplot below, the percentage of S&P 500 stocks trading above their 200-dma is represented on the X axis, and the forward 12-month price return for each breadth reading is displayed on the Y axis.
While the chart illustrates market breadth and market returns may not have a clear linear relationship — largely due to lower-tail breadth readings generating large returns — returns are more consistent and positive as breadth improves, which is especially evident when breadth readings advance above the 70–80% threshold. In fact, when at least 75% of S&P 500 stocks are trading above their 200-dma, forward 12-month index price returns have averaged 11.0%, with 85% of occurrences generating positive returns (since 1991).
Market Breadth vs. Market Returns

Source: LPL Research, Bloomberg 04/02/24
Disclosures: All data as of 1991–YTD. Past performance is no guarantee of future results. All indexes are unmanaged and can’t be invested in directly.
The latest leg higher for the broader market has been powered by widespread participation — it is not just a mega cap story. Last week, 86% of S&P 500 stocks closed above their 200-dma, marking the highest breadth reading since 2021. Moreover, the highest breadth readings at the sector level come from more cyclical areas such as financials, industrials, energy, and technology. This is the kind of leadership you want in a bull market.
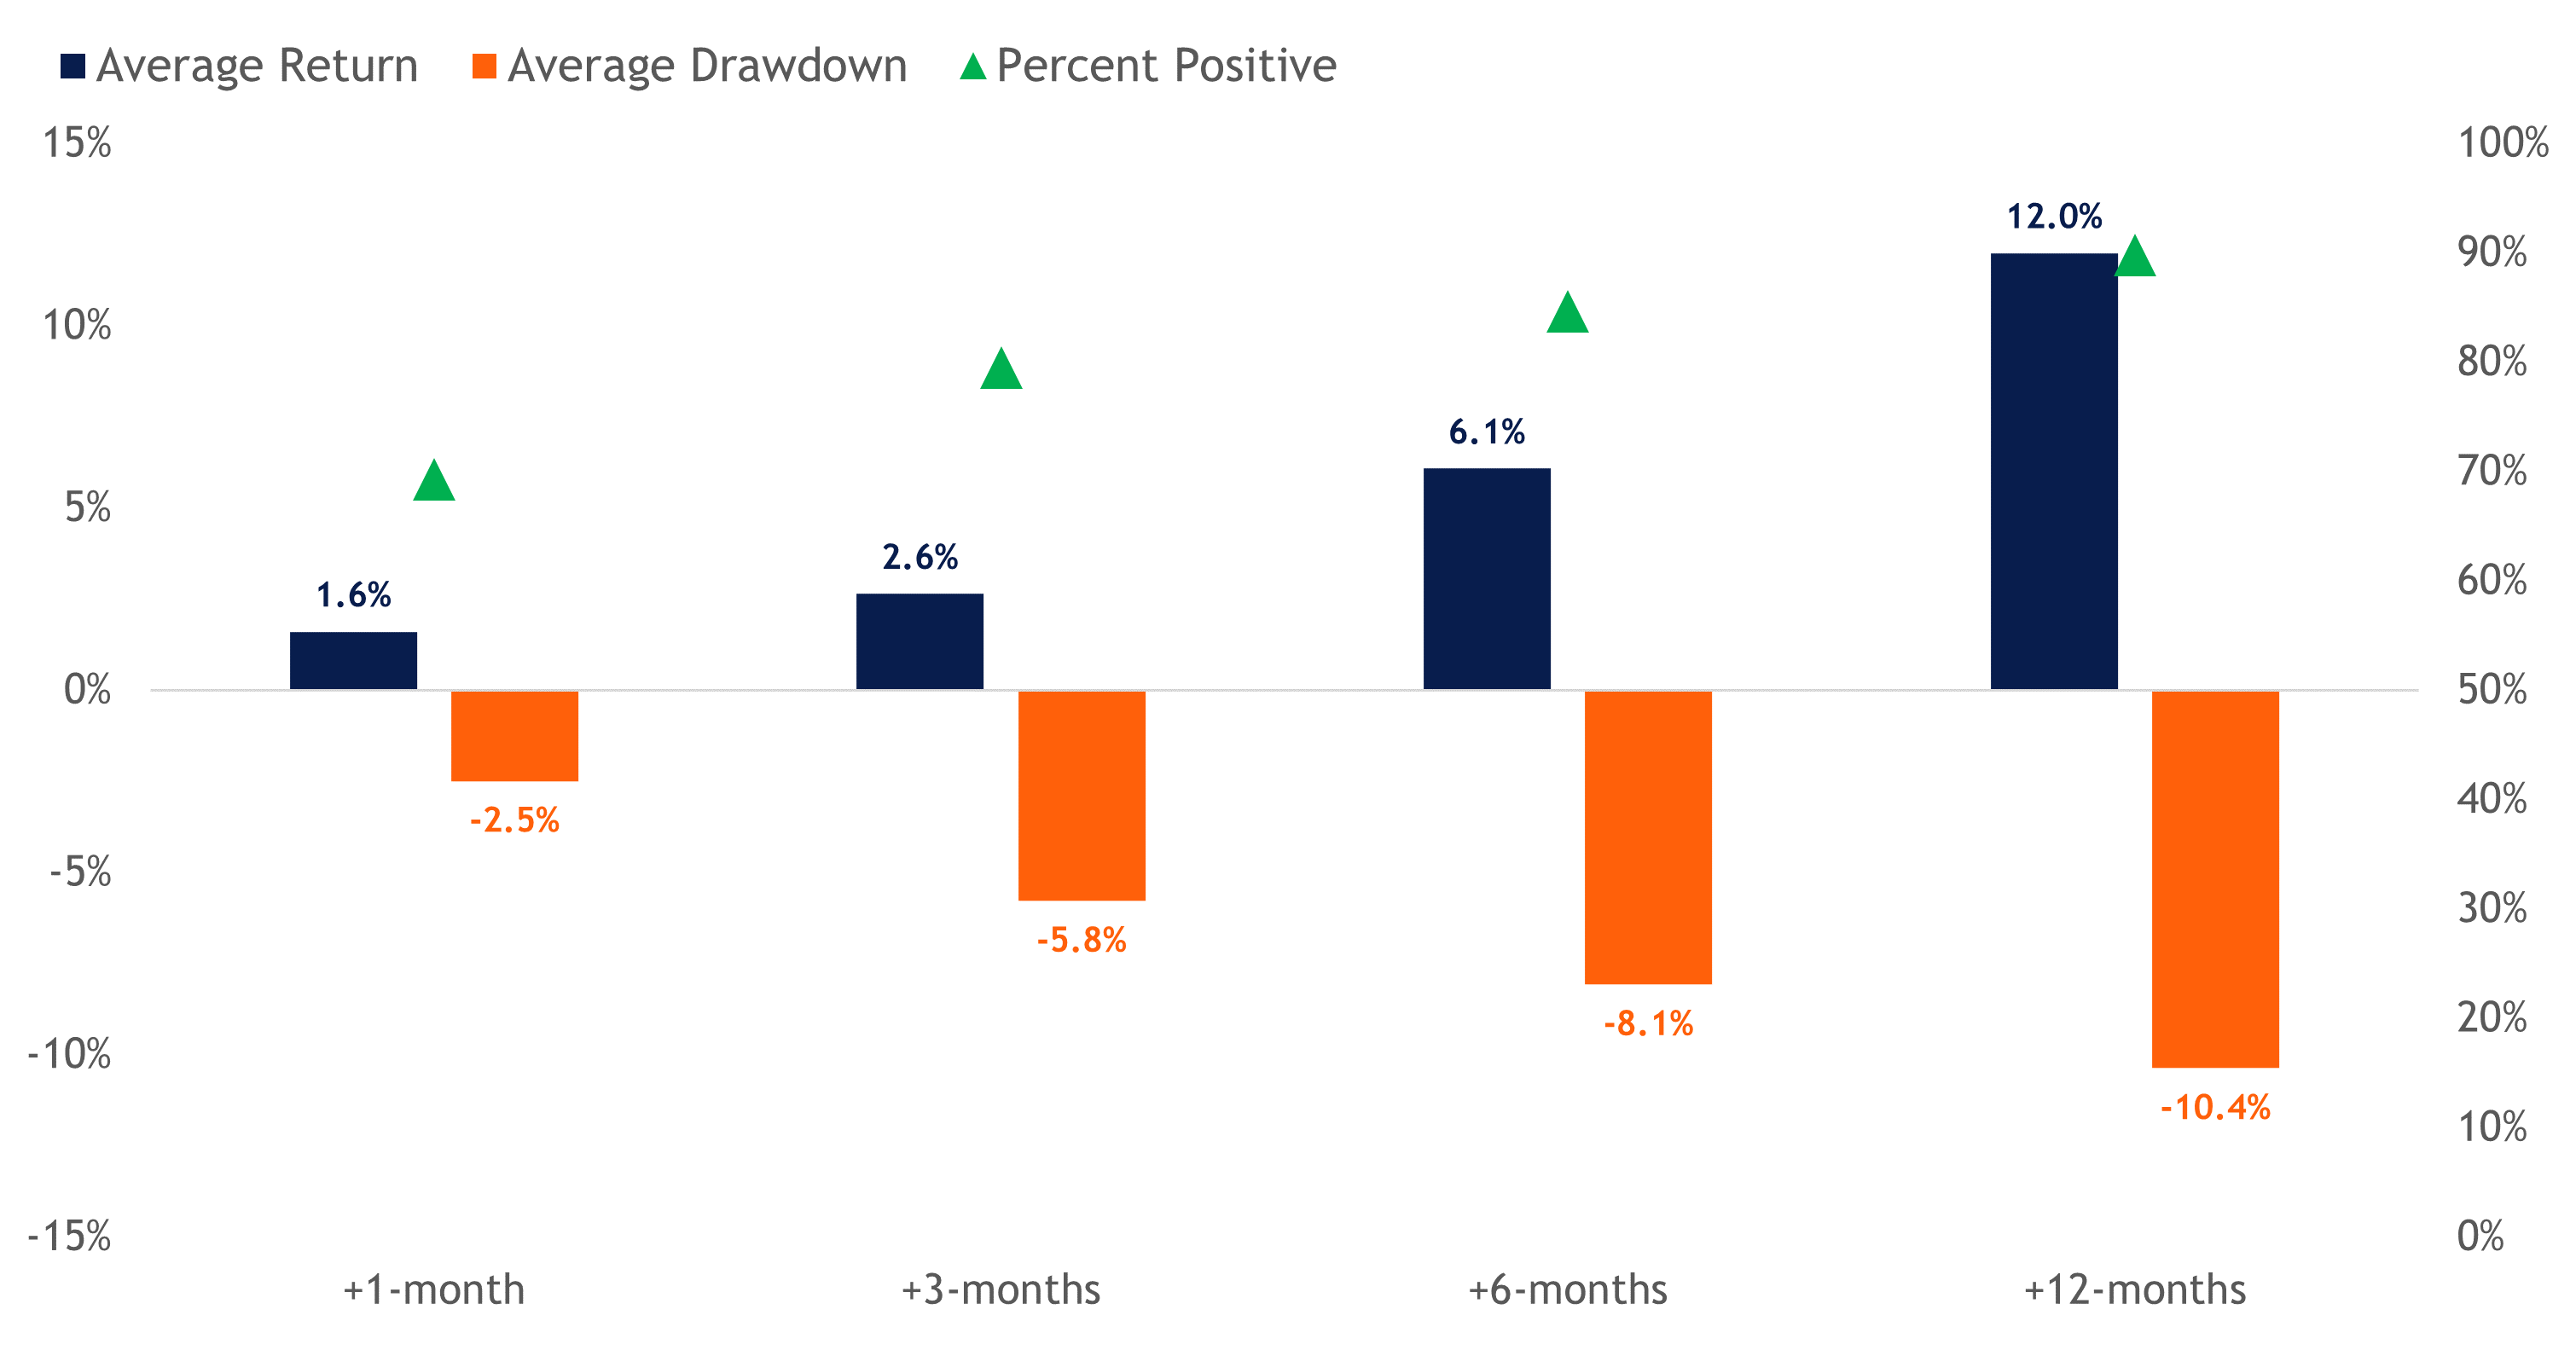
Given the broadening out of the rally, we backtested how the market performed whenever the percentage of S&P 500 stocks trading above their 200-dma crossed above the 80% threshold, as was the case earlier this month. To eliminate overlapping signals, we also filtered for crossovers occurring at least two months apart.
As highlighted in the table below, notable expansions in market breadth are historically associated with solid forward returns over the next 12 months, with relatively minimal average drawdowns and a high frequency of positive results.
Market Performance When Breadth Notably Expands
S&P 500 returns after the percentage of stocks above their 200-dma crossed above 80%.

Source: LPL Research, Bloomberg 04/02/24
Disclosures: All data as of 1991–YTD. Past performance is no guarantee of future results. All indexes are unmanaged and can’t be invested in directly.
Summary
Market breadth is an important indicator to assess the overall health of the market. Current breadth readings suggest a healthy and sustainable bull market. Participation in the rally has notably expanded, especially among the more cyclical sectors. While there are signs of overbought conditions percolating; overbought does not mean the rally is over. Perhaps more importantly, comparable breadth readings to today’s market imply pullbacks and/or corrections should be used as buying opportunities, as upside momentum tends to continue over the next 12 months.
IMPORTANT DISCLOSURES
This material is for general information only and is not intended to provide specific advice or recommendations for any individual. There is no assurance that the views or strategies discussed are suitable for all investors. To determine which investment(s) may be appropriate for you, please consult your financial professional prior to investing.
Investing involves risks including possible loss of principal. No investment strategy or risk management technique can guarantee return or eliminate risk.
Indexes are unmanaged and cannot be invested into directly. Index performance is not indicative of the performance of any investment and does not reflect fees, expenses, or sales charges. All performance referenced is historical and is no guarantee of future results.
This material was prepared by LPL Financial, LLC. All information is believed to be from reliable sources; however LPL Financial makes no representation as to its completeness or accuracy.
Unless otherwise stated LPL Financial and the third party persons and firms mentioned are not affiliates of each other and make no representation with respect to each other. Any company names noted herein are for educational purposes only and not an indication of trading intent or a solicitation of their products or services.
Asset Class Disclosures –
International investing involves special risks such as currency fluctuation and political instability and may not be suitable for all investors. These risks are often heightened for investments in emerging markets.
Bonds are subject to market and interest rate risk if sold prior to maturity.
Municipal bonds are subject and market and interest rate risk and potentially capital gains tax if sold prior to maturity. Interest income may be subject to the alternative minimum tax. Municipal bonds are federally tax-free but other state and local taxes may apply.
Preferred stock dividends are paid at the discretion of the issuing company. Preferred stocks are subject to interest rate and credit risk. They may be subject to a call features.
Alternative investments may not be suitable for all investors and involve special risks such as leveraging the investment, potential adverse market forces, regulatory changes and potentially illiquidity. The strategies employed in the management of alternative investments may accelerate the velocity of potential losses.
Mortgage backed securities are subject to credit, default, prepayment, extension, market and interest rate risk.
High yield/junk bonds (grade BB or below) are below investment grade securities, and are subject to higher interest rate, credit, and liquidity risks than those graded BBB and above. They generally should be part of a diversified portfolio for sophisticated investors.
Precious metal investing involves greater fluctuation and potential for losses.
The fast price swings of commodities will result in significant volatility in an investor's holdings.
Securities and advisory services offered through LPL Financial, a registered investment advisor and broker-dealer. Member FINRA/SIPC.
Not Insured by FDIC/NCUA or Any Other Government Agency | Not Bank/Credit Union Deposits or Obligations | Not Bank/Credit Union Guaranteed | May Lose Value
